risto.py -- Robot Framework's Historical Reporting Tool
risto.py is a tool for plotting graphs about test execution history based on statistics read from Robot Framework output files. Actual drawing is handled by Matplotlib tool, which must be installed separately. risto.py is included in source distributions and can also be downloaded from http://code.google.com/p/robotframework/wiki/HistoricalReportingTool.
Synopsis
risto.py options input files
risto.py options1 --- options2 --- optionsN --- input files
risto.py --argumentfile path
Options
-C, --nocritical Does not plot graphs for critical tests. -A, --noall Does not plot graphs for all tests. -T, --nototals Does not plot total graphs. -P, --nopassed Does not plot passed graphs. -F, --nofailed Does not plot failed graphs. -t, --tag <name> Adds graphs for these tags. The name can contain "*" and "?" as wildcards. "AND" in the given name is converted to " & ", to make it easier to plot combined tags. -o, --output <path> The path to the image file to create. If not given, the image is opened into Matplotlib viewer. -i, --title <title> The title of the graph. Underscores in the given title are converted to spaces. By default, there is no title. -w, --width <inches> The width of the image. The default is 800. -h, --height <inches> The height of the image. The default is 400. -f, --font <size> The font size used for legends and labels. The default is 8. -m, --marker <size> The size of the marker used with tag graphs. The default is 5. -x, --xticks <num> The maximum number of ticks on the x-axis. The default is 15. -n, --namemeta <name> The name of the metadata of the top-level test suite where to get the name of the test round. By default, names are got from the paths to input files. --argumentfile <path> Reads arguments from the specified file. --verbose The verbose output. --help Prints this help. --version Prints the version information.
Additionally, --- can be used to group options when creating multiple images at once.
Description
risto.py plots graphs about test execution history, based on statistics read from Robot Framework's XML output files. By default, it draws total, passed and failed graphs for critical tests and all tests, but it is possible to omit some of these graphs and also to add graphs by tags.
Names of test rounds that are shown on the x-axis are, by default, obtained from the paths to input files. Alternatively, names can be obtained from the metadata of the top-level test suite (for more information, see Robot Framework's --metadata option).
Graphs are saved to a file specified with the --output option, and the output format is determined by the file extension. The supported formats depend on the installed Matplotlib back-ends, but at least PNG ought to be always available. If the output file is omitted, the graph is opened into Matplotlib's image viewer (which requires Matplotlib to be installed with some graphical front-end).
Examples:
risto.py --output history.png output1.xml output2.xml output3.xml
risto.py --title My_Report --noall --namemeta Date --output out.png *.xml
risto.py --nopassed --tag smoke --tag iter-* results/*/output.xml
It is possible to draw several graphs with different options at once. This is done by separating different option groups with three or more hyphens (---). Note that in this case, also paths to input files need to be separated from the options similarly:
risto.py -CAP -t tag1 --- -CAP -t tag2 --- -CAP -t tag3 --- outputs/*.xml
Instead of giving all options from the command line, it is possible to read them from a file specified with the --argument option. In an argument file, options and their possible arguments are listed one per line, and option groups are separated with lines of three or more hyphens. Empty lines and lines starting with a hash mark (#) are ignored:
risto.py --argumentfile arguments.txt
====[arguments.txt]===================
--title Overview
--output overview.png
----------------------
--nocritical
--noall
--nopassed
--tag smoke1
--title Smoke Tests
--output smoke.png
----------------------
path/to/*.xml
======================================
Installation
risto.py itself does not need to be installed, simply running it from the command line is enough, but it has some preconditions. The most obvious one is Python, and versions 2.5 and 2.4 have been tested. Some Robot Framework internal modules are also needed, and thus Robot Framework version 1.8 or newer is required.
The Matplotlib tool is used for plotting graphs, and it needs to be installed separately. Matplotlib has its own preconditions, and at least NumPy needs to be installed. The default Matplotlib installation should always support at least PNG outputs, but if more output formats are needed, some extra back-ends may need to be installed. Additionally, you may need to install graphical front-ends to be able to use Matplotlib's own viewer for opening graphs without saving them to a file.
risto.py reads statistics from XML output files using the ElementTree module. Python 2.5 and newer have this module in standard library, but for older versions it needs to be installed separately.
Links to the needed software:
- Matplotlib
- http://matplotlib.sourceforge.net/
- NumPy
- http://numpy.scipy.org/
- ElementTree
- http://effbot.org/zone/element-index.htm
Screenshots
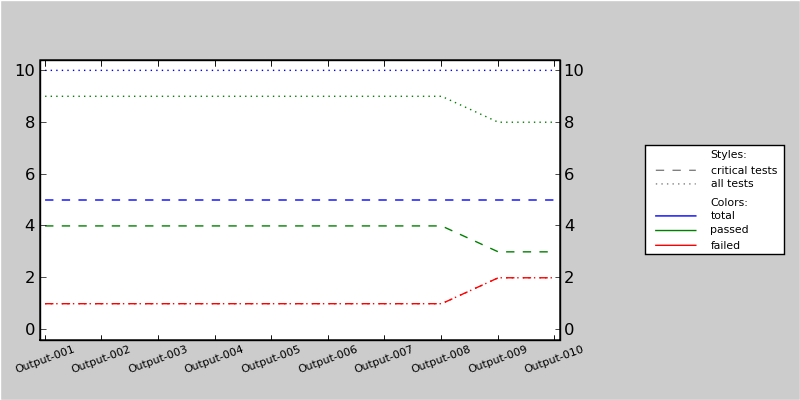
Default settings
The screenshot below uses some very simple example outputs, thus the lines are mainly straight. The default settings have been used otherwise, but the output has been saved into a file with the --output default.png option.
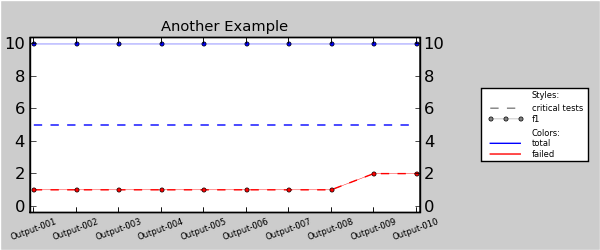
Various settings
The example outputs used in this screenshot are the same as in the previous one, but now the following options have been specified:
--nopassed --noall --tag f1 --title Another_Example --width 600 --height 250 --font 6 --marker 3 --output another.png
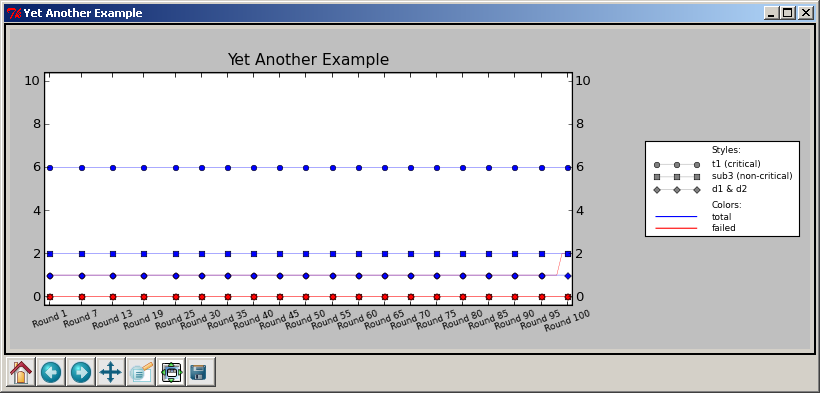
Using Matplotlib's viewer
This time there are more input files and the image has been opened in Matplotlib's viewer (that is, the --output option has not been used). The options used to create this example are the ones below:
-CAP -t d1_AND_d2 -t t1 -t sub3 -i Yet_Another_Example -x 20 -w 1000 -n Name
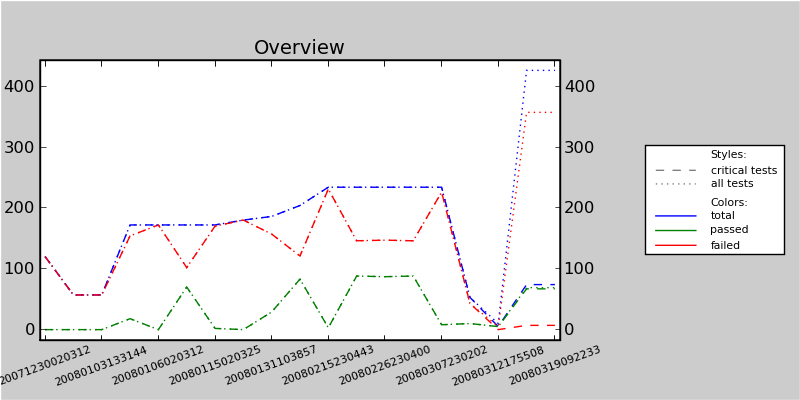
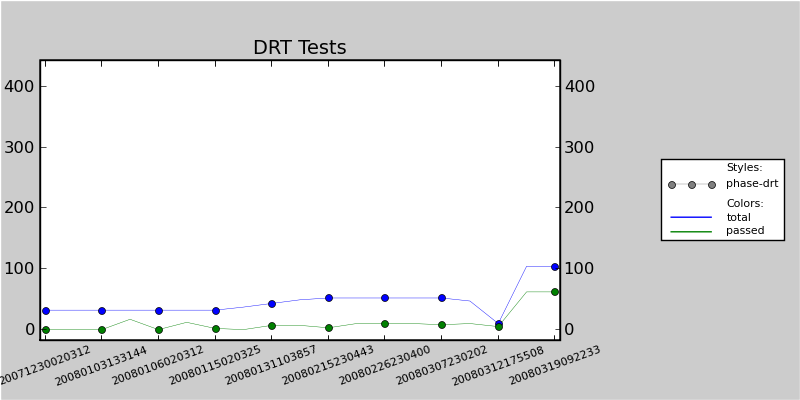
More realistic examples
These examples are generated from actual test outputs using the following argument file:
--title Overview
--output overview.png
-----------------
--title DRT Tests
--nocritical
--noall
--tag phase-drt
-nofailed
--output drt.png
------------------
path/*/output.xml